Return on Investment
A New Consideration for Arts Education Advocacy and Policy Work
As part of an upcoming Thought Leader Forum titled Every School, Every Child, I was asked by Janet Brown, CEO of Grantmakers in the Arts, to spend some time with their newly released report Foundation Funding for Arts Education: An Update on Foundation Trends by Steven Lawrence, director of research, and Reina Mukai, research manager, both from the Foundation Center.
Initially Brown and I thought that it might be productive to treat the report to a policy analysis, in the hope that it would shed some light on funding and equity of access to arts education in K–12 public schools. The idea here was to create a policy analysis for GIA’s Reader and for it to serve as something that could be presented at the Thought Leader Forum to help provoke discussion.
After further consideration we settled on a more reflective piece. A significant factor in moving away from a policy analysis was in the data itself: The report, a good one, is more of a scan and lacks the sorts of comprehensive data that would be best suited to a formal policy analysis.
That said, let’s take a look. The report addresses data on giving from 1999 through 2012 with the goal of identifying trend lines and is based on Foundation Center’s annual grants data sets. Each set includes all grants of $10,000 or more awarded to organizations by one thousand of the largest US foundations by total giving. It represents roughly half of total grant dollars awarded by the universe of independent, corporate, community, and grantmaking operating foundations in that year. The 2012 grants set included 153,821 grants totaling $22.4 billion, and the 1999 set included 81,112 grants totaling $8.6 billion. Grants to individuals and grants from donor-designated and restricted funds of community foundations are not included. It does not differentiate between in-school and out-of-school-time programs and sorts grants into two key categories: capital and all other types of support.
The report does not segment K–12 from other categories and includes higher education. Data are segmented for field (performing arts, dance, theater, multidisciplinary, literary, etc.), recipient type (performing arts organizations, music, performing art centers, arts councils, visual arts organizations, etc.), and as mentioned above, capital versus other types of support including programmatic.
As a final bit of context, the report establishes a framework for defining arts education, glossary style:
Arts education grantmaking has been divided into the major areas of multidisciplinary arts education, performing arts education, visual arts education, museum arts education, and literary arts education and broadly defined as supporting:
- Single-discipline and multidisciplinary arts-in-education and arts and education organizations and programs
- Educational activities and outreach programs of museums, performing arts companies, visual arts centers, and other arts groups
- Development of arts curriculum, arts-related classroom space, and arts and performing arts facilities at schools, colleges, and universities
- Scholarships, fellowships, and residencies for young and emerging artists provided through arts groups and degree-granting arts institutions
- Community arts schools and arts education programs conducted by multipurpose community organizations and youth development groups
- Research on the role and effectiveness of artseducation and advocacy to expand and enhanceits influence
The key findings as stated in the report are:
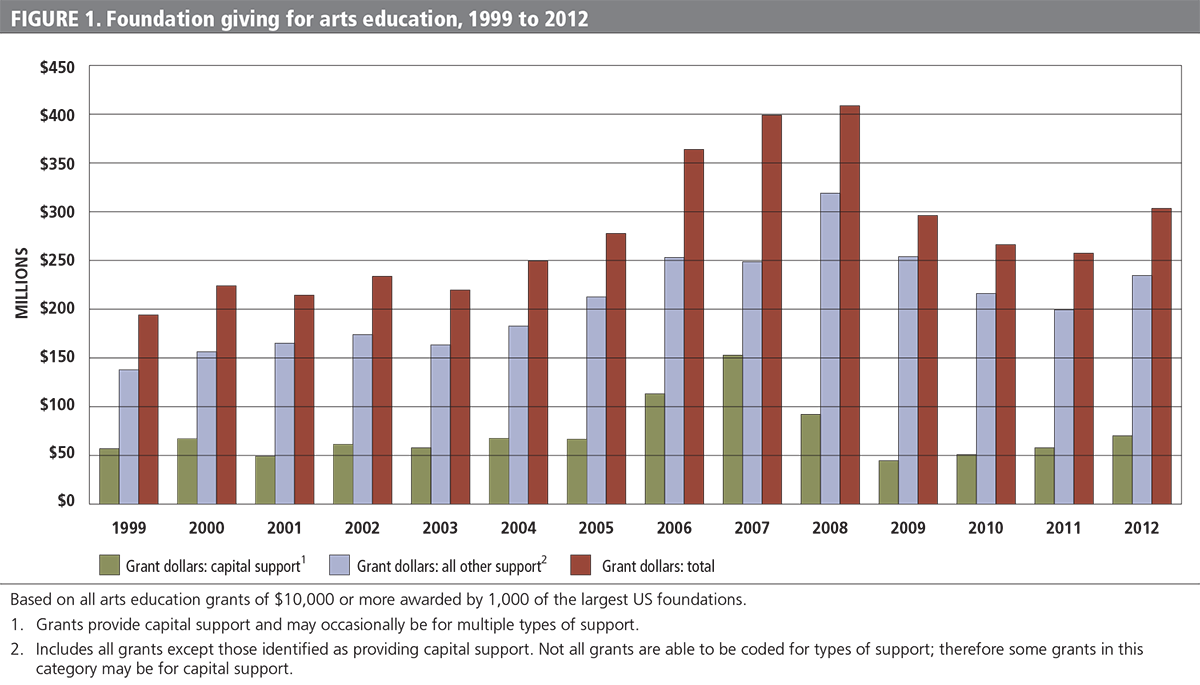
- Support for arts education grew by 57 percent between 1999 and 2012.
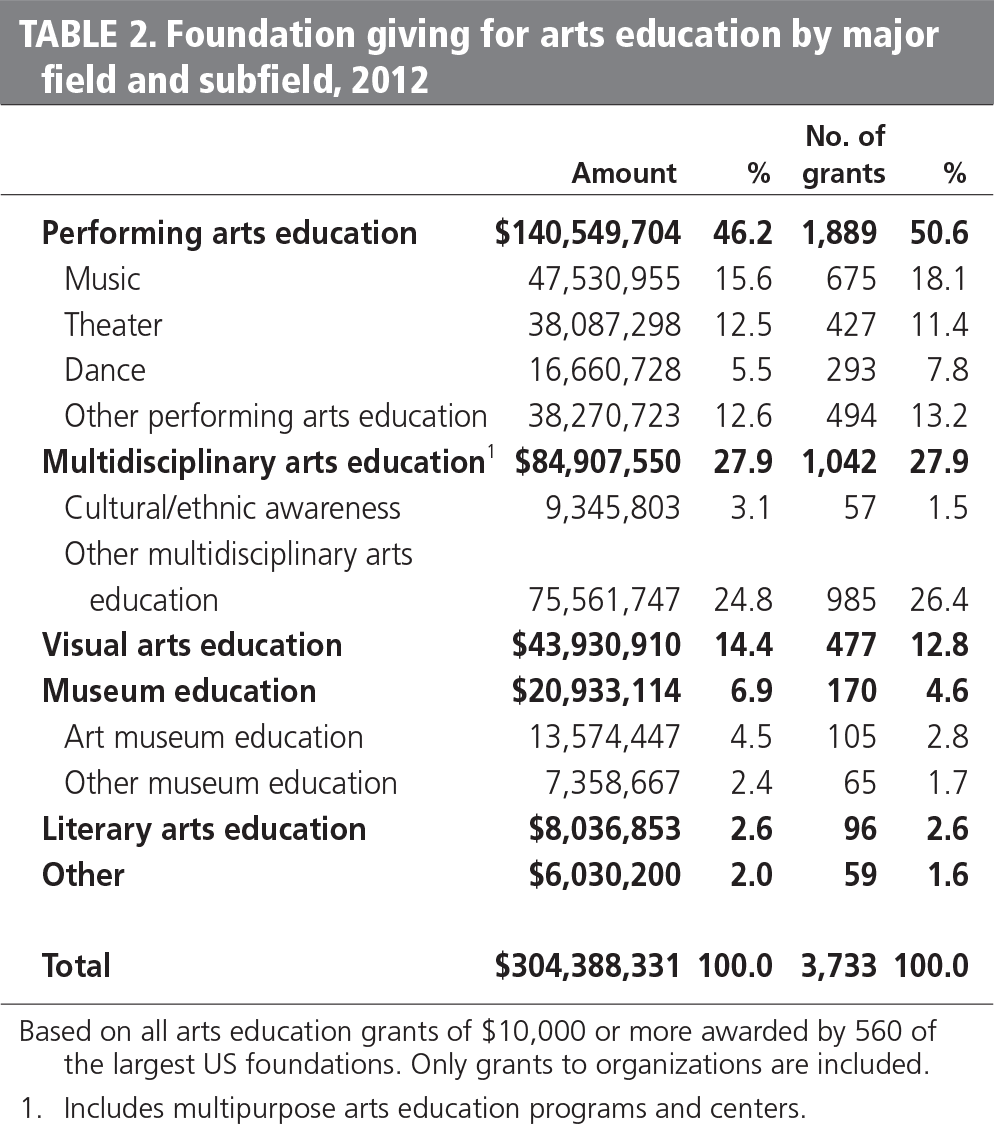
- Performing arts education benefited from roughly half of arts education giving.
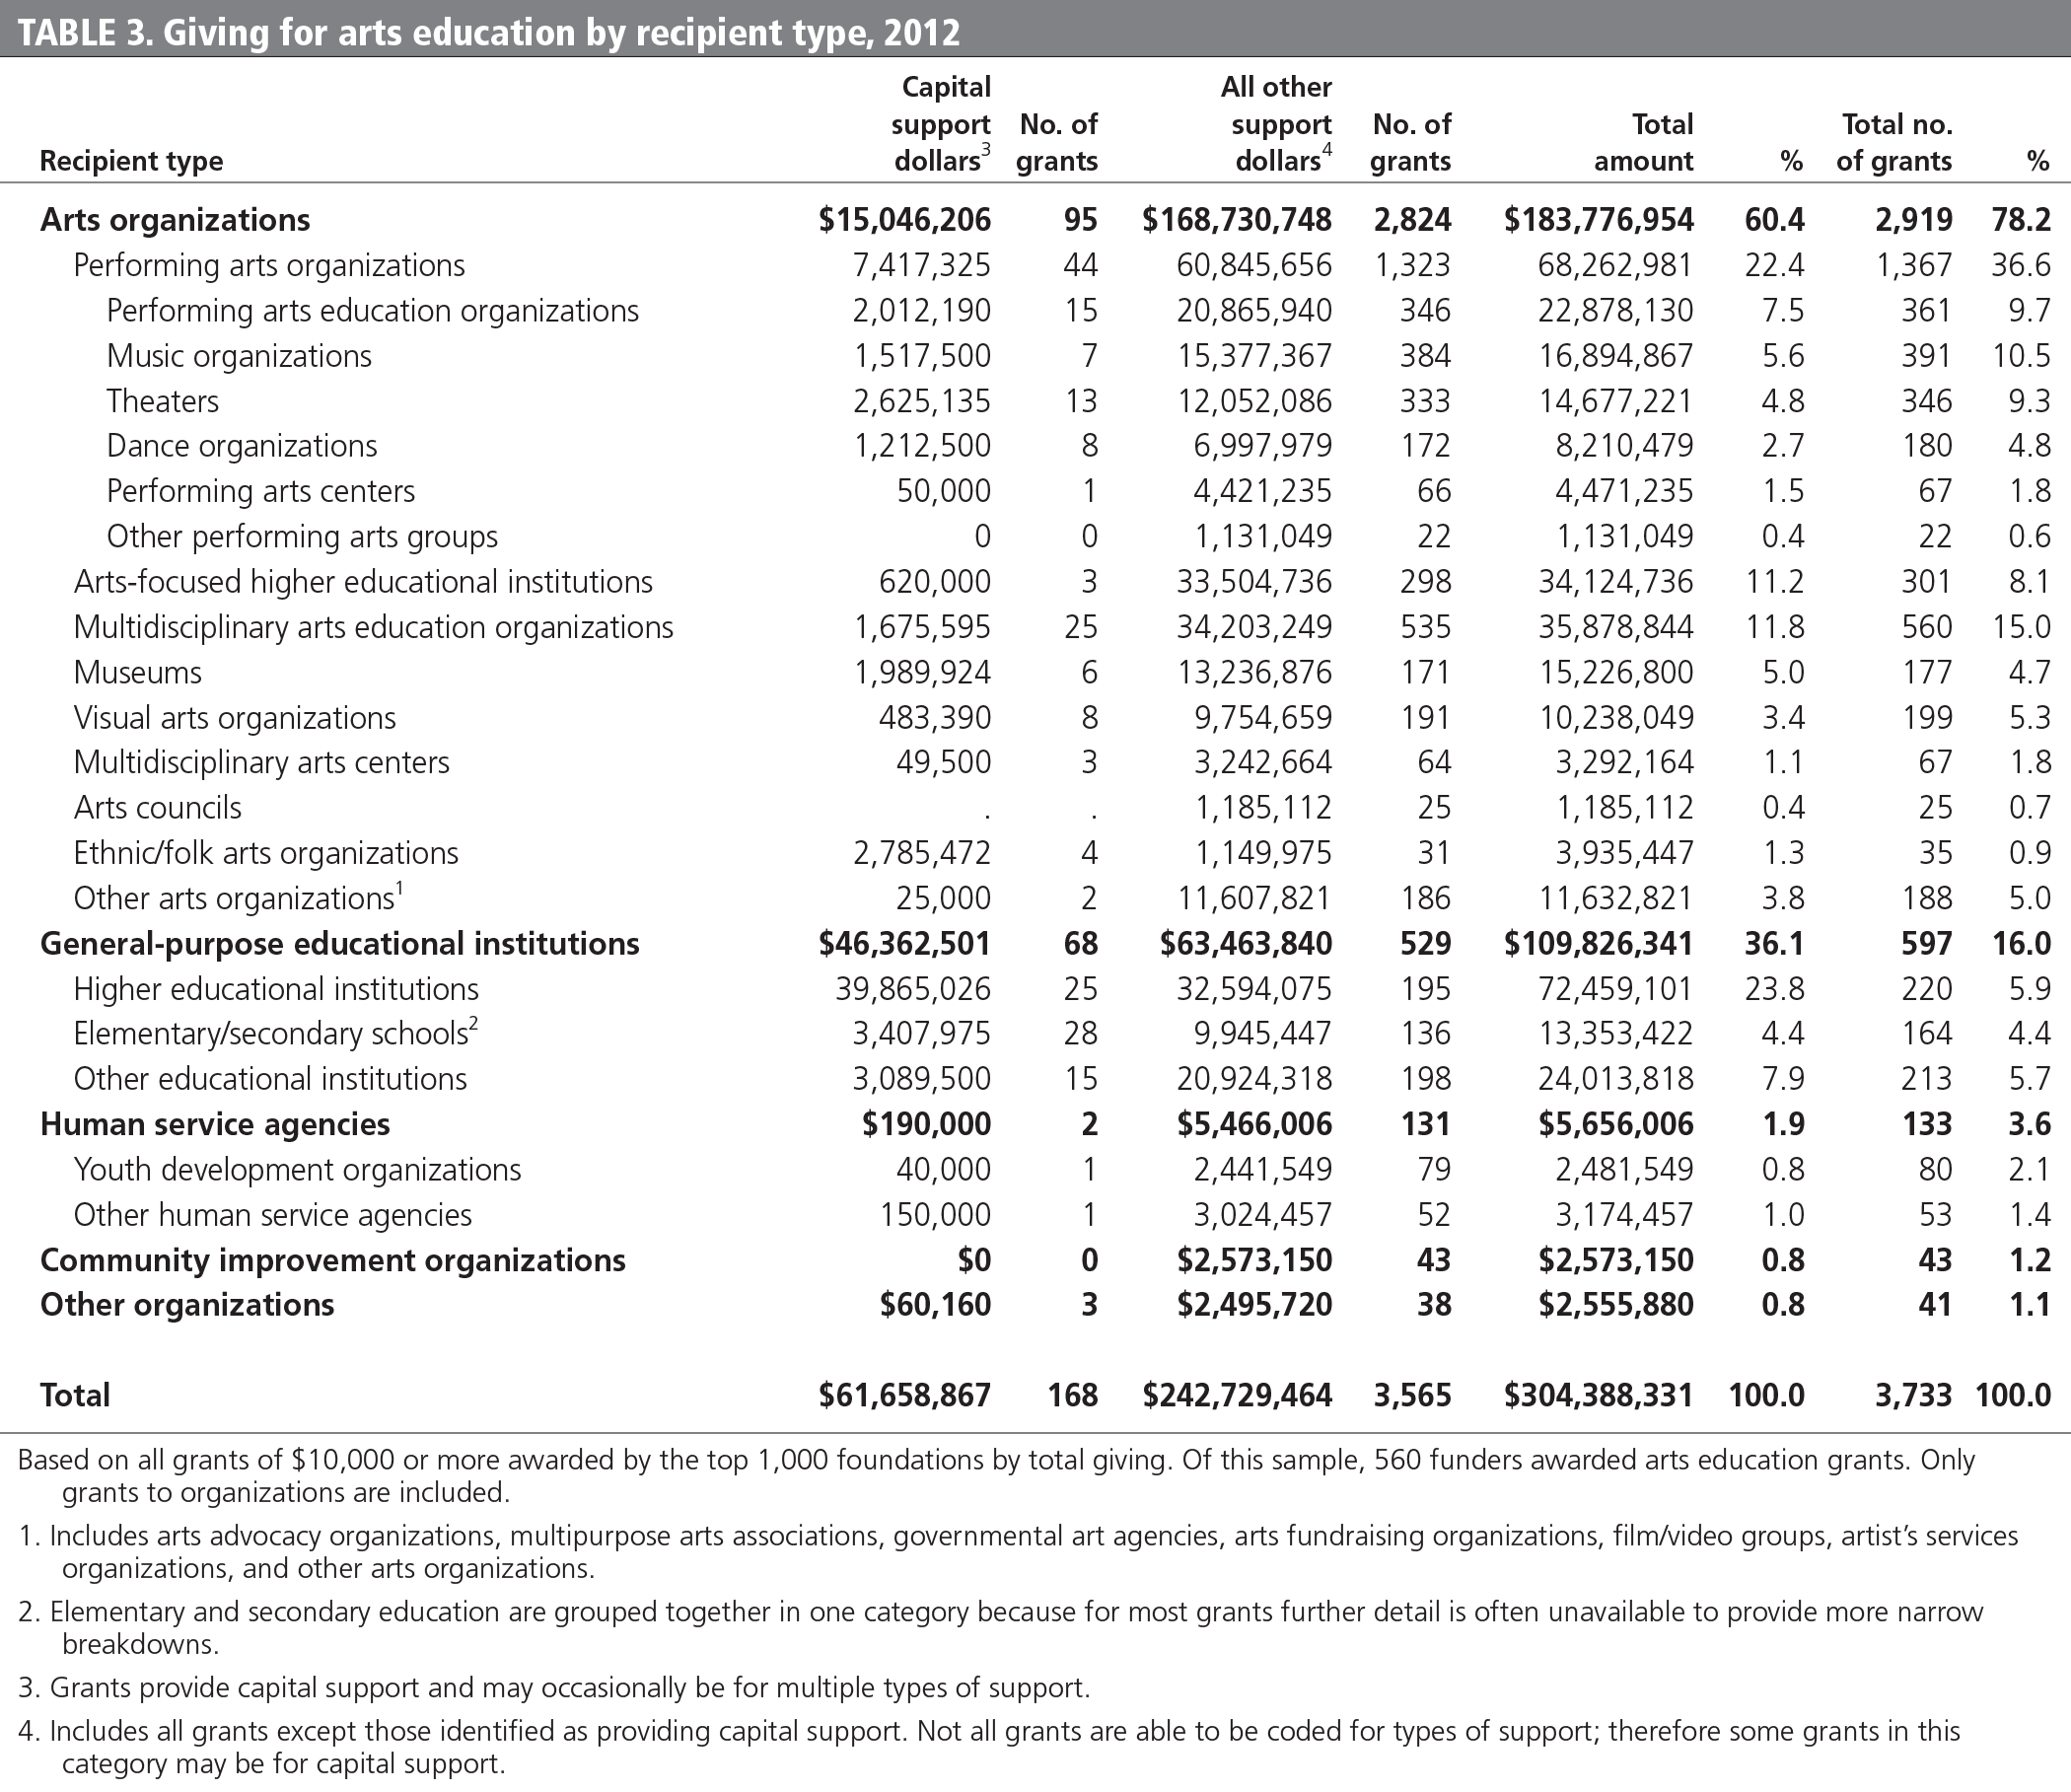
- Arts organizations received three out of five arts education dollars and four out of five arts education grants.
- A majority of arts education grants targeted children and youth.
While funding for arts education has grown over the thirteen years of data analyzed in the report, dollars peaked in 2008, with a substantial falloff correlated to the Great Recession. In the last year of data, 2012, we begin to see a recovery after overall declines across 2009–11 (see figure 1).
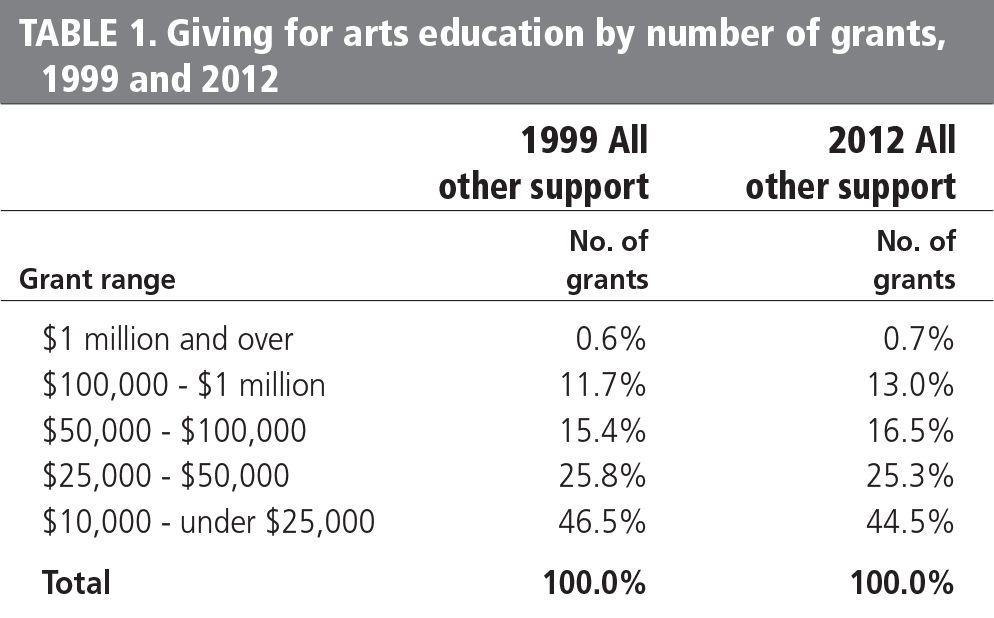
In looking at size of grants (noncapital), across all years of data, the vast majority are made in the range of under $25,000 (see table 1).
For giving by field (see table 2), in the last year of data analyzed (2012), performing arts education was the most heavily funded, at $140,549,704. Within that category, music received the most funding. The second highest category of funding by field was multidisciplinary ($84,907,550), followed by visual arts education ($43,930,910), museum education ($20,933,114), literary arts education ($8,036,853), and all others ($56,030,200).
For grants by recipient type in the last year of data analyzed (2012) (see table 3), in terms of total dollars, arts organizations again received the most funding. An interesting data point in the following table shows that elementary and secondary schools received 4.4 percent of all funding.
As a postscript, the report looks forward to challenges to the field in terms of funding for arts education focusing primarily on the question of engaging the next generation of donors:
So after skimming the report and highlighting a few key points of data, what can we make of this report from the vantage point of access and equity within K–12 higher education?
A good place to start is by bringing in another critical point of data not referenced in this report.
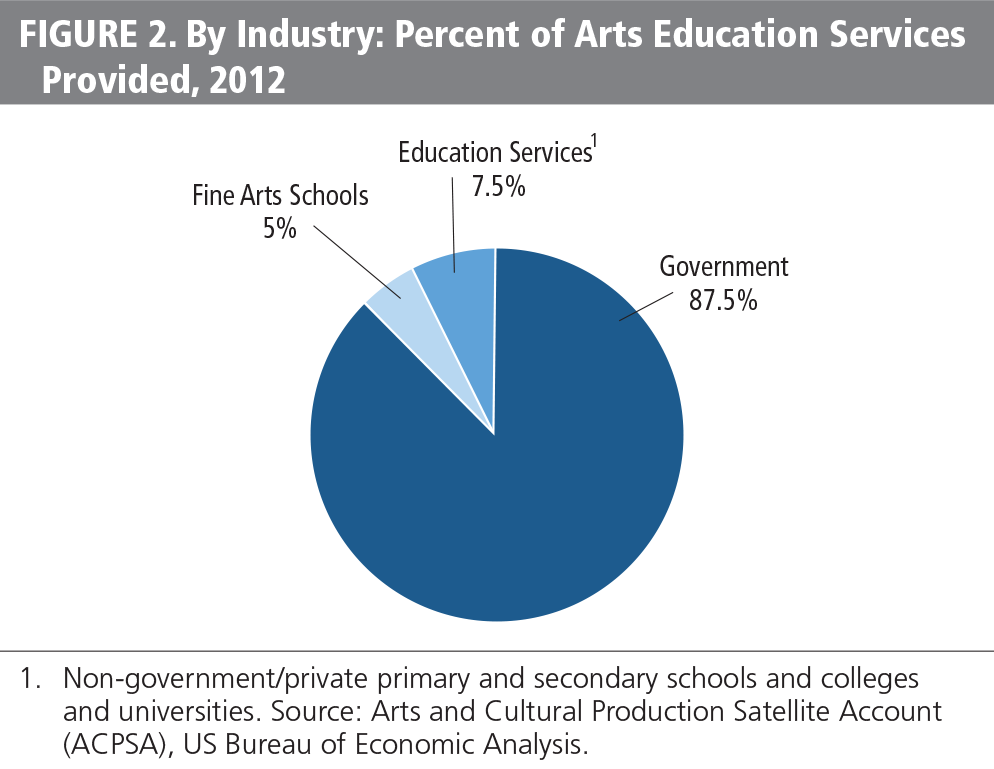
In the pie chart (see figure 2), the Arts and Cultural Production Satellite Account reveals that in 2012, 87.5 percent of arts education services provided in the United States came from government. When we place these data alongside the GIA report statistic that 4.4 percent of all funding goes to elementary and secondary schools, a picture emerges of the realm of funding for K–12 public school arts education, one that is primarily painted by the fractional amount that private funding brings to K–12 public school arts education. Consequently, funders need to think carefully about how their funding can leverage government dollars. Both strategy and tactics are critical in this regard. From the vantage point of equity, the economics of public schools dictate that programmatic funding can never result in all students receiving a quality arts education.
I think it is fascinating to consider the GIA report’s definition for advocacy: research on the role and effectiveness of arts education and advocacy to expand and enhance its influence.
Let’s take a moment to expand the world of advocacy and policy beyond this statement. Generally, the components of this work include the following:
- organizing: build power at the base
- educate legislators: provide information on issues
- educating the public about the legislative process
- research
- organizing a rally: mobilize for your cause
- regulatory efforts
- public education
- nonpartisan voter education: inform the electorate on the issues
- nonpartisan voter mobilization
- educational conferences
- training
- litigation
- lobbying: advocate for or against specific legislation. All nonprofits are permitted to lobby. 501(c)(3) public charities can engage in a generous but limited amount of lobbying.
Let’s now build out further by looking at two calls to the funding field. The first is recommendations made to funders in 2010 by the National Committee for Responsible Philanthropy (NCRP):
Those two benchmarks provide a foundational touchstone for this new report. New analyses of education grant data suggests that of 672 foundations included in the sample, only 11 percent devoted at least half of their education grant dollars to marginalized communities and only 2 percent devoted at least one-quarter of their education grant dollars for systemic change and social justice. This suggests that many foundations seeking to improve education may not be as strategic in their grantmaking as they intend.
The second call is by Gara LaMarche, former head of Atlantic Philanthropies:
On the GIA website is a terrific series of white papers from organizations involved in systemic change. After reading these papers, I thought about the field of arts education and the many areas that have grown and matured. A lot of great work is going on, and I think it is important to note some fundamental areas that continue to evolve and grow:
- continued evolution of the teaching artist
- divergent organizational models/approaches coupled with better field-wide communications and support
- exemplary partnerships with districts (particularly midsized and smaller districts)
- citywide and region-wide coordination
- blending of in-school, out-of-school time, and community-based arts education
- better preservice training and professional development
- enduring models: some have weathered the vicissitudes of change (turnover of elected officials, economic downturns, educational policy churn, district leadership musical chairs, 50 percent of new teachers resigning by fifth year, etc.)
- bridges to important areas of multidisciplinary learning (STEAM)
- new national standards
- evolving assessment practice and better longitudinal research
- growth in parent and family programs/partnerships
- better data gathering and potential to take advantage of the world of big data
With all of this impressive growth and evolution, I believe that just as the GIA report understates advocacy and policy in its definition of arts education, it is clear from the report overall that advocacy and policy are lagging well behind. But if programmatic work cannot achieve equitable access to quality arts education, then the challenge to the field is substantial.
Speaking from experience, I see a tendency among arts education colleagues to overstate their work in advocacy and policy. There is lots of soft stuff going on, such as the sharing of Americans for the Arts policy pieces and one-day trips for “lobbying day.” But the real work of advocacy and policy is a long way off, partly due to the reluctance of funders to embrace the NCRP recommendations or LaMarche’s missive about the importance of this work (excerpted from a formal report by the Atlantic Philanthropies on the very topic of funding advocacy and policy).
Some of the reasons why this area has been slow to emerge have to do with concerns around concrete results, confusion around what is allowed by law, and a general fear of conflict.
Let’s now take a quick look at two examples of successful work in advocacy and policy — the real deal stuff — and why this work should be further developed, supported, and ultimately embraced as we have all the other areas of practice.
The first is the California Alliance for Arts Education (CAAE), led by Joe Landon, executive director. They have four staff members, and according to their 2012 federal Form 990, they had total revenues of $532,192.
By any measure, this is a small organization, except when it comes to return on investment. Here, by creating organizational agency in policy research, government affairs, constituency building, and much more, CAAE was able to open up arts education funding in California to $1.6 billion in annual Title I funding. Their direct and well-documented efforts led to clarification on use of Title I funding (“Improving the Academic Achievement of the Disadvantaged”).
The math is not hard (really!). Four staff and $532,192 in annual funding open up $1.6 billion of annual funding to the neediest of K–12 public school students. The success is not by accident. It is through commitment to developing expertise and practice, even on a surprisingly small budget. What might be possible here if CAAE were adequately funded?
The second star in the return-on-investment orbit is The Center for Arts Education (CAE). Once the largest private funder of arts education in New York City, providing support, coordination, training, and more to what at one time were 130 schools partnered with over four hundred cultural providers, higher education, and community-based organizations, CAE has evolved its work into the rare hybrid of advocacy/policy and programs. (Without the programmatic work, there would likely not be enough funding to sustain the organization.)
According to CAE’s federal Form 990, in 2012 they had a total staff of fifteen (a minority of staff are dedicated to advocacy), total revenues of $1,957,375, and total expenses allocated to advocacy of $356,528.
So, for $356,528 in advocacy expenses, what has been the return on investment for CAE? In 2013 their sustained efforts in lobbying, policy research, coalition building, media relations, and more led to $92 million in new direct funding for arts education in the New York City Public Schools. Uniting the mayor and city council around this issue saw $23 million base-lined in the New York City budget for four years.
This work does not happen overnight. It requires new skills and a new view on how we evaluate success, and sometimes it puts organizations and the people associated with them into conflict, because when it comes down to it, they stand for something.
So in the end, my reflection is that when it comes to K–12 arts education equity, we are unlikely to get there in any sustained and significant way unless we as a field come to terms with the holistic maturing of our work through the support and development of serious capacities in advocacy and policy. And let us not forget that the equity issue remains one of inner-city public schools students getting the short end of the stick. These students are largely of color, economically disadvantaged, and heavily reliant on their schools for a sound and basic education because their parents cannot afford private lessons, special programs, and other arts experiences that come at a cost that can be dear. To get to every child, every school, we will have to move to a broad approach that includes policy and advocacy, adequately funded and supported. If you want all kids to have what the arts offer, then think about how you can make this happen. If it is more kids rather than all, well, you can always stick with a purely programmatic approach.