Foundation Grants to Arts and Culture in 2018: A One-Year Snapshot
Download:![]() Arts Funding Snapshot: GIA’s Annual Research on Support for Arts and Culture (1.1Mb)
Arts Funding Snapshot: GIA’s Annual Research on Support for Arts and Culture (1.1Mb)
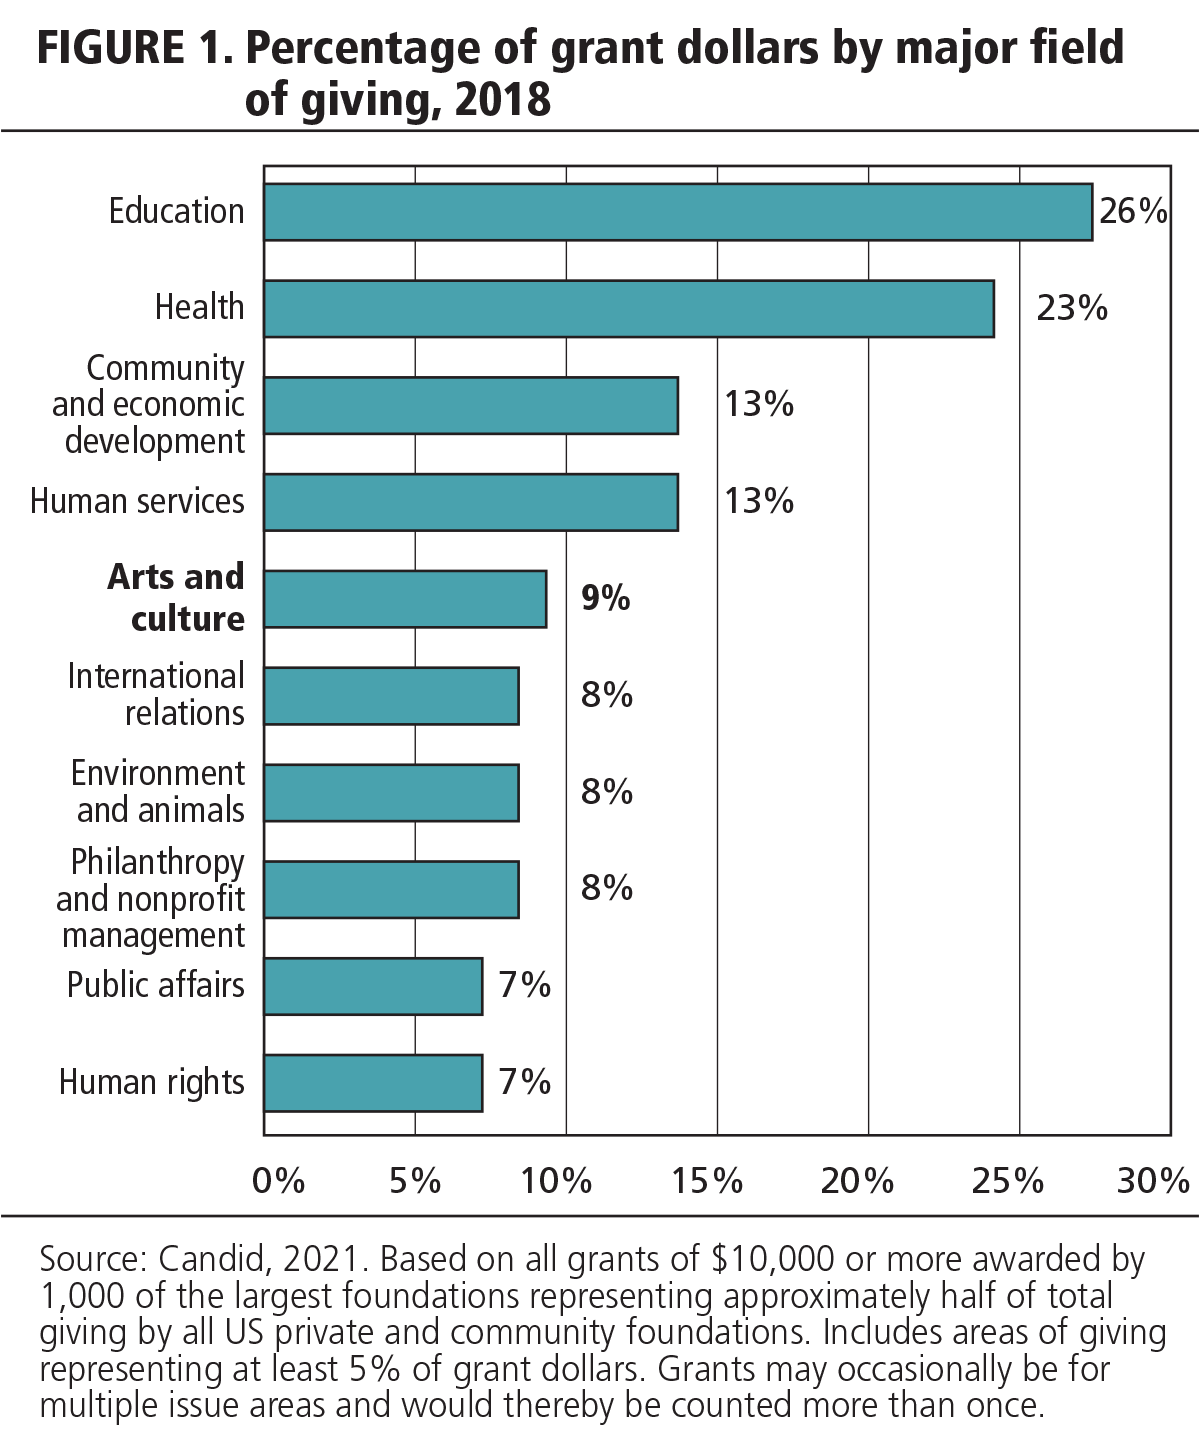
In 2018, giving by the approximately 86,000 active US private and community foundations rose 4% to $80.7 billion. Among the largest US independent, corporate, community, and grantmaking operating foundations included in Candid’s 2018 Foundation 1000 data set, overall giving was down 2% among a matched set of funders, however, arts and culture funding was up 7%. Arts and culture remained among top foundation funding priorities ranking fifth following human services.
Highlights
Candid offers these key findings from GIA’s nineteenth snapshot of foundation giving to arts and culture. The definition of arts and culture used for this snapshot is based on Candid’s Philanthropy Classification System and encompasses funding for the performing arts, museums, visual arts, multidisciplinary arts, humanities, historical activities, arts services, folk arts, public arts, and cultural awareness. The findings in this snapshot are based on analysis of two closely related data sets. The analysis of the distribution of 2018 arts and culture giving uses the latest Foundation 1000 dataset,1 while the analysis of changes in foundation giving for the arts between 2017 and 2018 use a matched set of foundations that are consistent between the Foundation 1000 for each of those two years.2
The foundation grantmaking examined here represents only one source of arts financing. It does not examine arts support from earned income, governments, individual donors, or the business community. This analysis also looks only at foundation arts support for nonprofit organizations, and not for individual artists, commercial arts enterprises, or informal and unincorporated activities.
Arts funding as a share of total dollars was up in 2018.
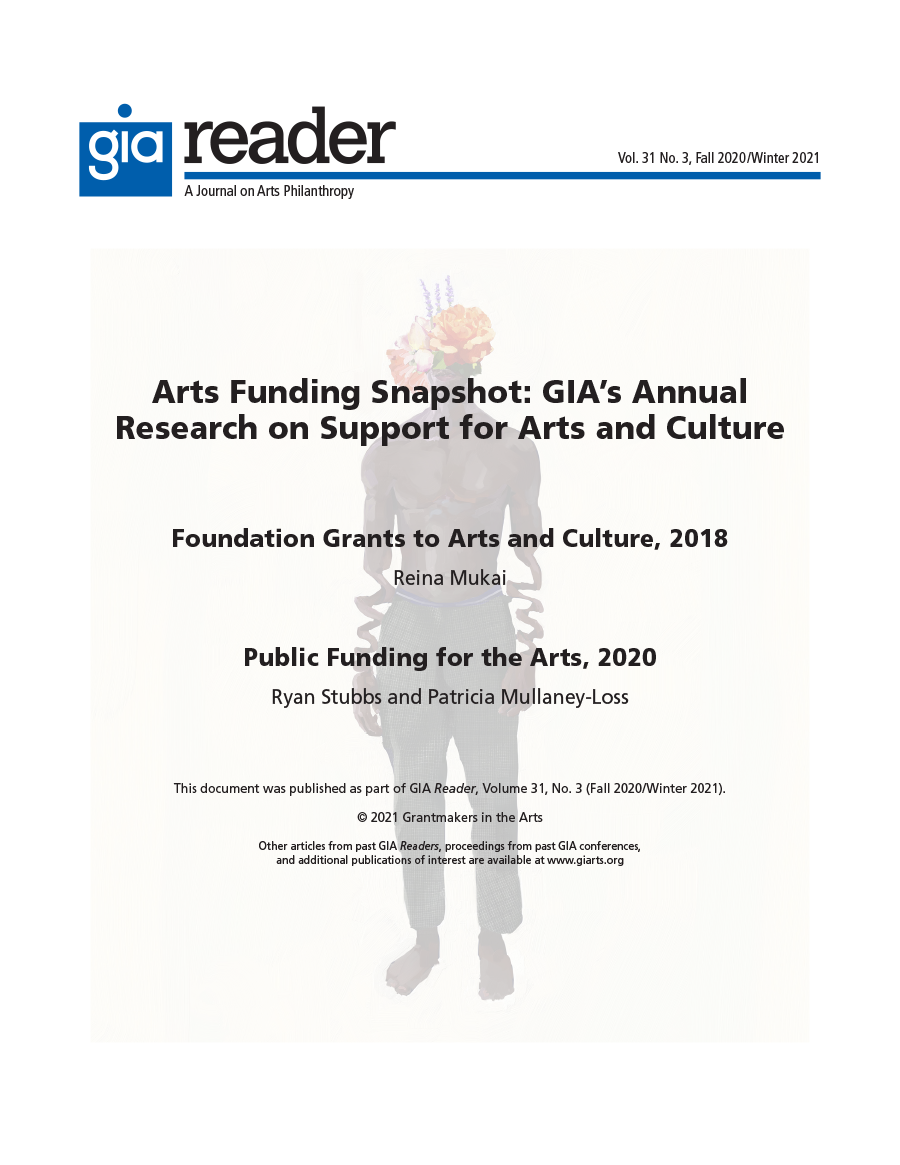
Among the 1,000 largest foundations included in Candid’s grants sample for 2018, arts giving totaled $3 billion, or 9% of overall grant dollars. Compared to the previous year, share of dollars was up slightly and share of number of grants remained basically unchanged.
Foundation funding for arts and culture was up in 2018.
Among a matched set of leading funders, arts funding increased 7% between 2017 and 2018 compared to a 2% decline in overall giving by these foundations.
The size of the median arts grant was up.
The median arts and culture grant size — $28,150 — increased from $27,500. This was below the $35,000 median amount for all foundation grants in the latest year.
Large grants account for more than half of arts grant dollars.
Large arts grants of $500,000 and more captured 65% of total grant dollars for the arts in 2018, up from 63% in 2017.
Relative to overall giving, a larger share of arts grant dollars was for general operating support.
In 2018, general operating support accounted for 25% of arts and culture grant dollars. The share is significantly higher than the 19% share awarded for general operating support for overall giving.
Top arts funders accounted for a larger share of overall giving than in 2017.
The top twenty-five arts funders by giving amount provided 42% of total foundation arts dollars in 2018, up from the 38% share reported in 2017. The share of arts giving accounted for by the top funders has remained relatively consistent for the past decade.
Specific Findings
Overall foundation dollars for the arts.
The foundations included in Candid’s 2018 Foundation 1000 data set awarded 19,074 arts and culture grants totaling $3 billion, or 9% of overall grant dollars. Compared to the previous year, the share for arts dollars was up slightly (8% in 2017), while the share of number of grants remained basically unchanged. Among a matched subset of 839 funders, grant dollars for the arts was up 7% between 2017 and 2018, compared to a 2% decrease in grant dollars overall. Among the top-ranked subject areas by grant dollars, international relations, public affairs, human rights, and human services reported the fastest increases in dollars.
The impact of exceptionally large grants.
Every year and in all funding areas, a few very large grants can skew overall totals, creating distortions in long-term grantmaking trends. In 2018, 22 arts and culture grants provided at least $10 million, and instances where these grants had a notable impact on grantmaking patterns are identified throughout this analysis. Yet despite the potential fluctuations caused by these exceptional grants, Candid data in all fields have always included them, providing consistency over time.3
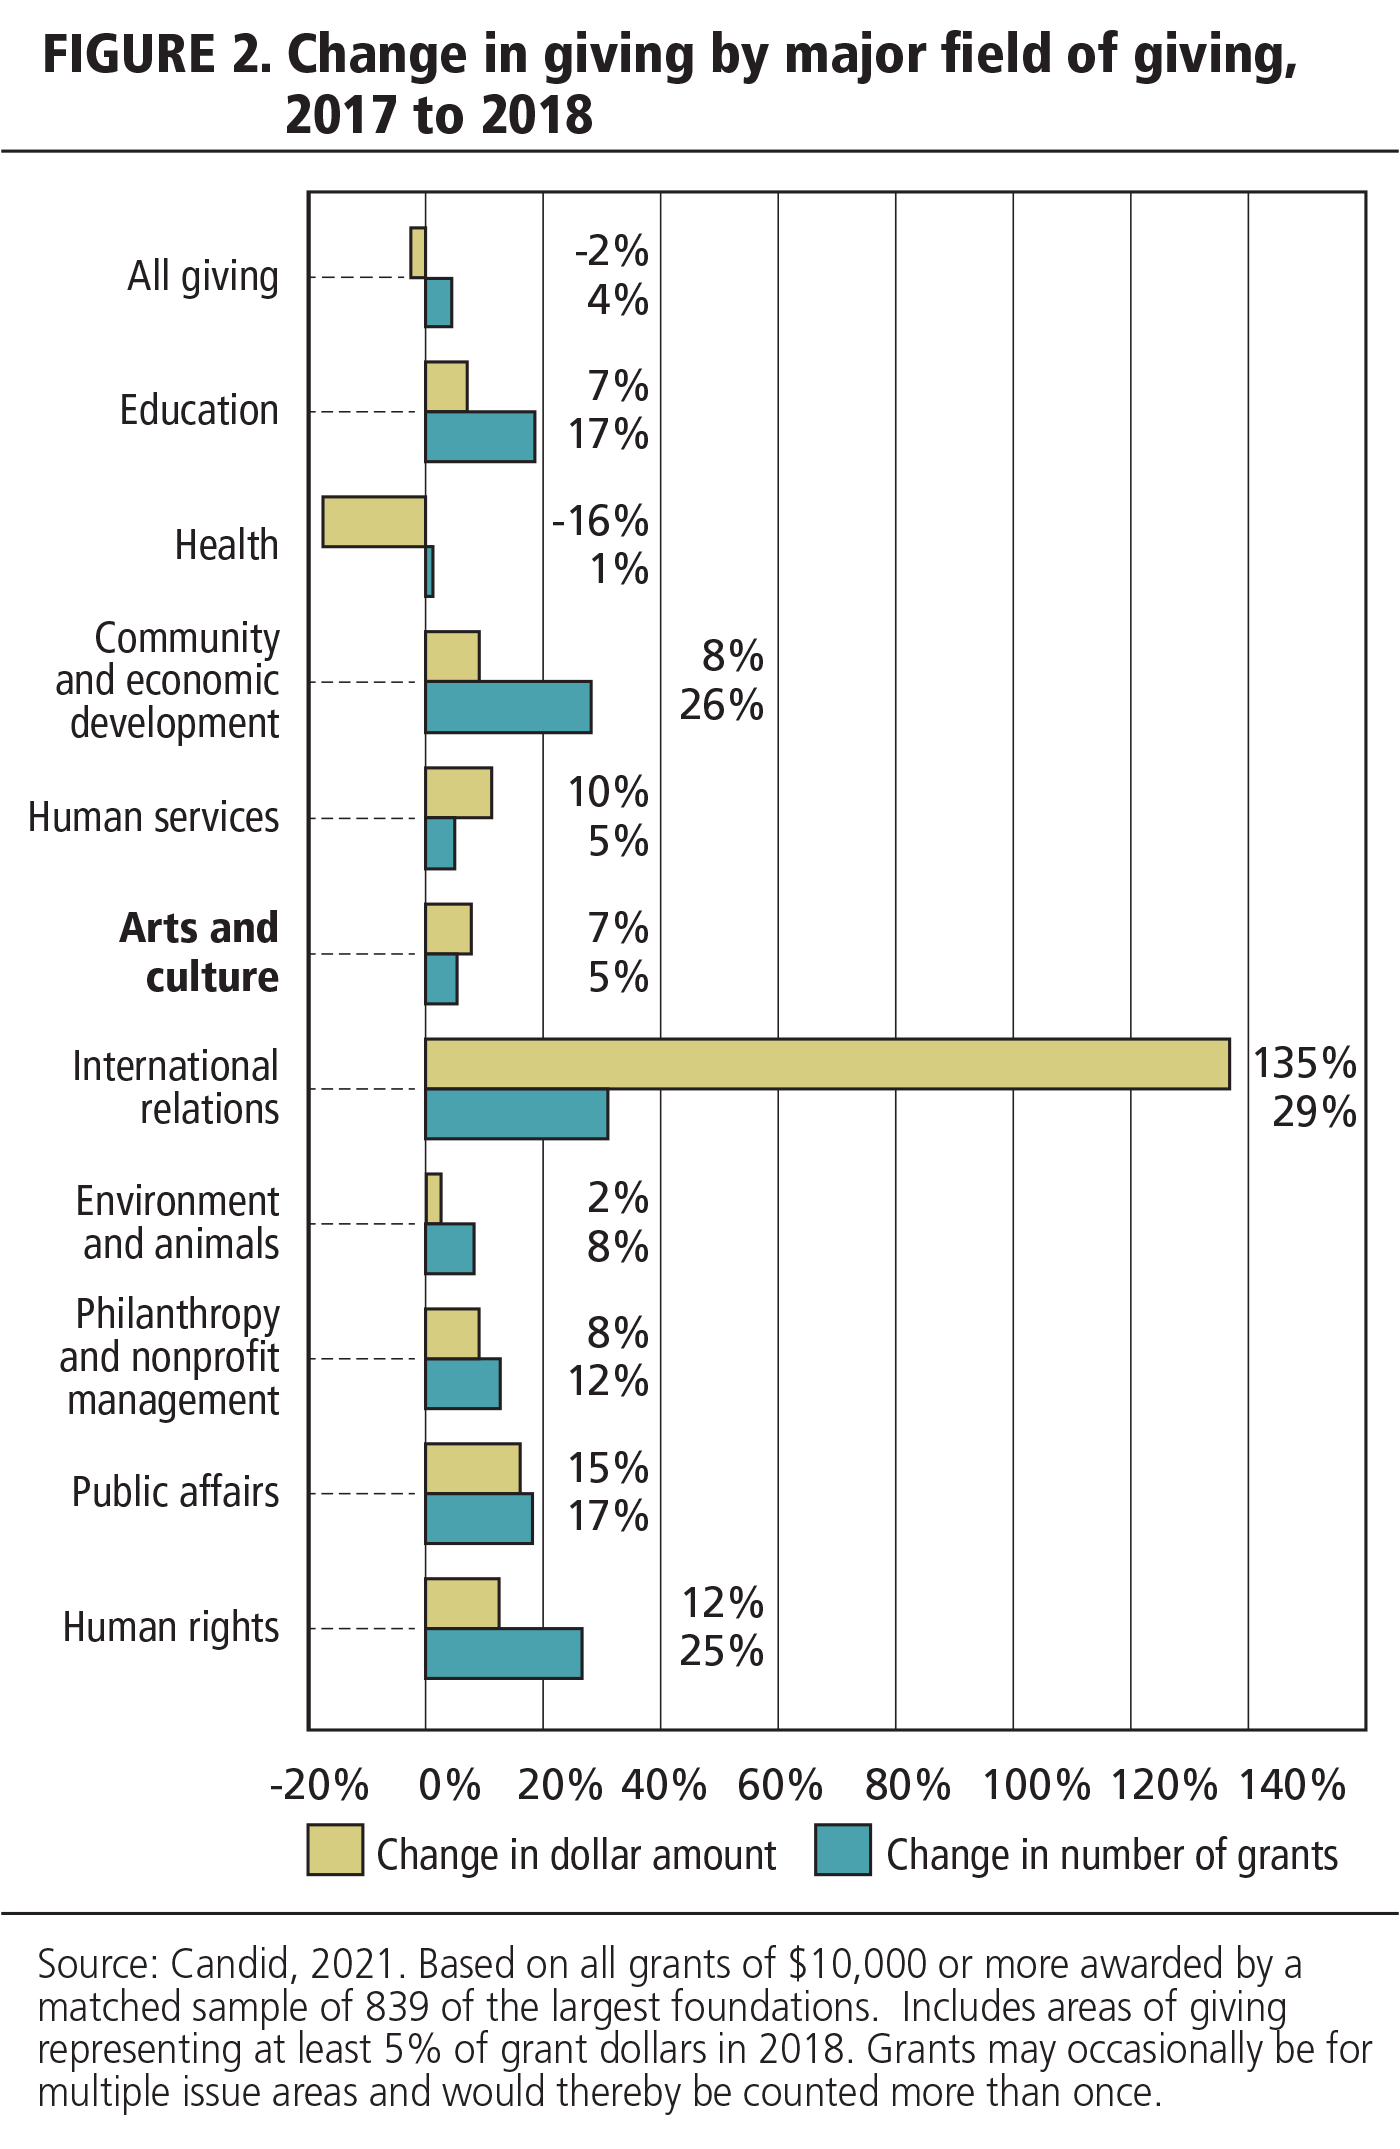
Corporate foundations represent an important source of support for arts and culture.
Corporate foundations account for roughly 8% of overall US private and community foundation giving, and these larger corporate foundations included in the 2018 grants sample provided 5% of grant dollars for the arts. Actual grant dollars totaled $153 million. By number, corporate foundations allocated 1,619 grants, or 9%, of the overall number of arts grants in 2018. These figures do not include direct corporate giving; the amount that corporations contribute to the arts is undoubtedly higher.
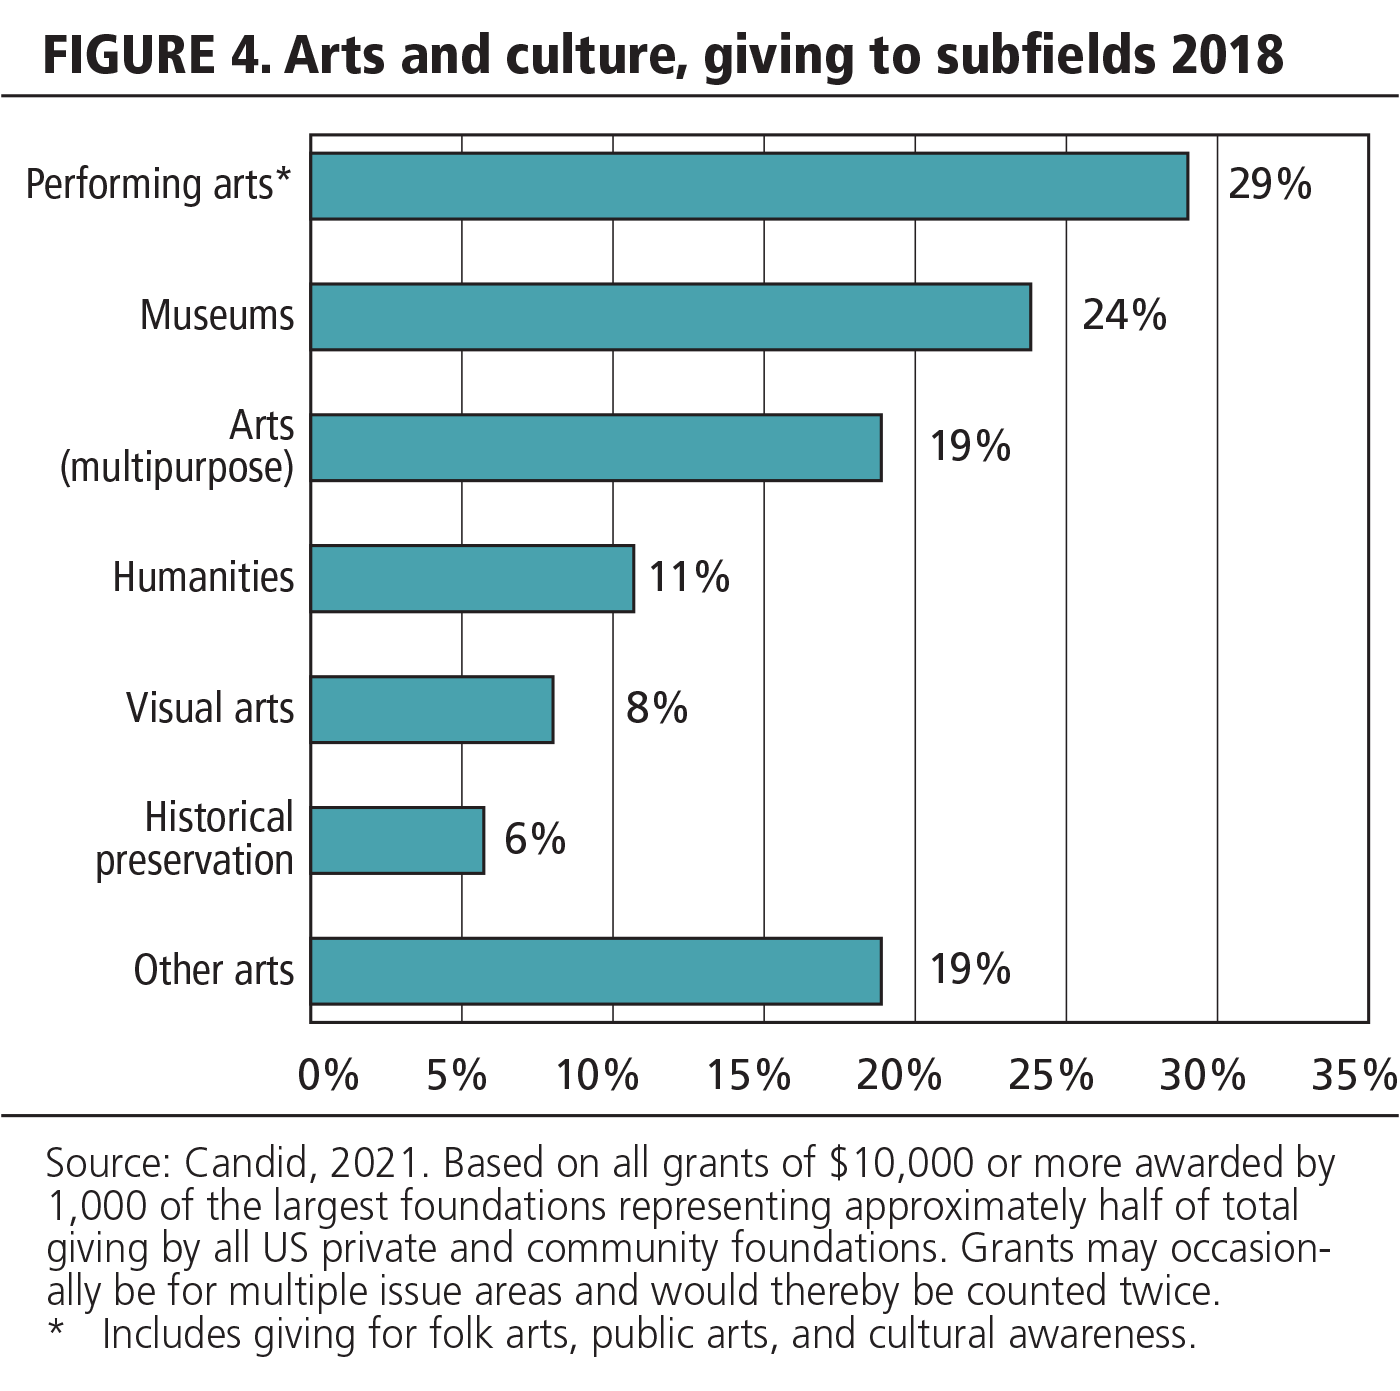
Grants by Arts Subfield
Funding for performing arts accounted for close to one-third of all foundation art dollars in 2018, surpassing the share reported for museums (24%). From the start of the 1980s until 1997, the performing arts have consistently received more foundation support than museums. However, museums surpassed the performing arts by share in the late 1990s to early 2000s and several times in recent years (2010, 2013, and 2014). The shifts in share between these two fields of activity from year to year could be due to the entry onto the scene of new and large arts funders, extraordinarily large grants, the contribution of valuable art collections, and new capital projects at museums.
Giving to performing arts.
In 2018, among a matched set of funders, performing arts grant dollars was down 1% compared to 2017, while the number of grants increased 5%. A total of 7,729 grants were awarded for the performing arts by foundations in the set — more than double the number reported for museums. In general, the average performing arts grant tends to be smaller in size than the average museum grant (around $112,000 versus $221,000 in 2018). The largest share of giving to the performing arts supported theaters and performing arts centers. Among the largest performing arts grant in the latest sample was a $10 million general support award from the Community Foundation of Greater Memphis to Ballet Memphis. Included within the performing arts is support for performing arts education, which totaled $54.8 million in 2018. For more detail of foundation grant dollars supporting other types of arts education, see Giving to multidisciplinary arts.
Giving to museums.
In 2018, museums benefited from 3,228 grants totaling $714 million awarded by the 1,000 largest foundations included in the Foundation 1000 data set. Nearly half of funding supported art museums. Among a matched set of funders, grant dollars allocated to museums was down 8% between 2017 and 2018, while the number of grants declined 4%. The largest museum grant in 2018 was a $48.9 million grant from Silicon Valley Community Foundation to the Flying Heritage and Combat Armor Museum.
Giving to the humanities.
In 2018, the humanities benefited from 1,871 grants totaling $328 million awarded by the 1,000 largest foundations included in the Foundation 1000 data set.4 Funding for this area accounted for 10% of arts grant dollars in 2018, consistent with the share captured in 2017. Among a matched set of funders, grant dollars awarded for the humanities increased 8%, while the number of grants awarded was up 39%.
Giving to historic preservation.
Support for historic preservation declined 23% between 2017 and 2018 among a matched set of funders, while the number of grants awarded remained the same.5 Among the largest grants awarded for historic preservation in the latest year was a $5 million grant from the Andrew W. Mellon Foundation to Equal Justice Initiative for the construction of a center of education, interpretation, and art at the National Memorial for Peace and Justice, and the development of programs that will disseminate knowledge about the history of slavery in the United States. Overall, historic preservation benefited from 1,318 grants totaling $165.2 million in 2018.
Giving to multidisciplinary arts.
The share of arts giving for multidisciplinary arts went up to 19% in 2018 from 11% in 2017.6 Grant dollars awarded for multidisciplinary arts also increased 76% between 2017 and 2018 among the matched set of funders. Within multidisciplinary arts, arts services generally, defined as a provision of services to arts organizations, including facilities or touring assistance, saw a significant increase. Among the various subcategories of multidisciplinary arts, arts education (excluding performing arts education) totaled $92 million in the latest year.
Giving to the visual arts.
TABLE 1: Distribution of grants by support strategy, 2018
| Support strategy | Dollar amount | % | Number of grants | % |
|---|---|---|---|---|
| Capacity-building and technical assistance | 160,832,374 | 5.4 | 568 | 3.0 |
| Capital and infrastructure | 417,322,898 | 14.0 | 1,347 | 7.1 |
| Building acquisitions | 960,000 | – | 4 | – |
| Building and renovations | 189,187,374 | 6.3 | 385 | 2.0 |
| Capital campaigns | 86,442,087 | 2.9 | 255 | 1.3 |
| Collections acquisitions | 19,124,295 | 0.6 | 113 | 0.6 |
| Collections management and preservation | 15,534,439 | 0.5 | 25 | 0.1 |
| Equipment | 8,196,260 | 0.3 | 131 | 0.7 |
| Facilities maintenance | 4,800,996 | 0.2 | 9 | – |
| Information technology | 11,609,961 | 0.4 | 55 | 0.3 |
| Land acquisitions | 6,158,598 | 0.2 | 11 | 0.1 |
| Rent | – | – | – | – |
| Other capital and infrastructure | 100,149,411 | 3.3 | 431 | 2.3 |
| Financial sustainability | 189,794,065 | 6.3 | 755 | 4.0 |
| Annual campaigns | 25,107,753 | 0.8 | 119 | 0.6 |
| Debt reduction | 2,928,242 | 0.1 | 5 | – |
| Earned income | 145,000 | – | 4 | – |
| Emergency funds | 33,930,032 | 1.1 | 19 | 0.1 |
| Endowments | 101,780,830 | 3.4 | 136 | 0.7 |
| Financial services | 365,000 | – | 2 | – |
| Fundraising | 21,539,902 | 0.7 | 285 | 1.5 |
| Sponsorships | 7,563,945 | 0.3 | 27 | 0.1 |
| Other financial sustainability | 23,708,329 | 0.8 | 171 | 0.9 |
| General support | 745,868,643 | 24.9 | 5057 | 26.5 |
| Individual development and student aid | 125,957,986 | 4.2 | 679 | 3.6 |
| Leadership and professional development | 41,447,058 | 1.4 | 199 | 1.0 |
| Network-building and collaboration | 77,665,592 | 2.6 | 385 | 2.0 |
| Participatory grantmaking | 400,000 | – | 1 | – |
| Policy, advocacy, and systems reform | 59,518,610 | 2.0 | 260 | 1.4 |
| Advocacy | 19,878,809 | 0.7 | 93 | 0.5 |
| Coalition building | 360,000 | – | 2 | – |
| Equal access | 25,013,708 | 0.8 | 140 | 0.7 |
| Ethics and accountability | 497,500 | – | 9 | – |
| Grassroots organizing | 625,000 | – | 8 | – |
| Litigation | 60,000 | – | 3 | – |
| Public policy and systems reform | 3,185,663 | 0.1 | 30 | 0.2 |
| Other policy, advocacy, and systems reform | 14,603,414 | 0.5 | 51 | 0.3 |
| Publishing and productions | 348,318,505 | 11.6 | 2642 | 13.9 |
| Product and service development | 2,361,160 | 0.1 | 15 | 0.1 |
| Program support | 714,436,680 | 23.9 | 4451 | 23.3 |
| Public engagement and marketing | 125,936,034 | 4.2 | 399 | 2.1 |
| Research and evaluation | 78,997,094 | 2.6 | 202 | 1.1 |
| Other specified strategies | 119,129,625 | 4.0 | 284 | 1.5 |
| Not specified | 528,240,754 | 17.7 | 4,655 | 24.4 |
| Total | 2,989,899,989 | 100.0 | 19,074 | 100.0 |
Source: Candid, 2021. Based on all grants of $10,000 or more awarded by 1,000 of the largest foundations representing approximately half of total giving by all US private and community foundations. Grants may occasionally be for multiple support stategies, e.g., for new works and for endowment, and would thereby be counted twice.
Among a matched set of funders, grant dollars for the visual arts and architecture increased 37% between 2017 and 2018, while the number of grants for the field was up 6%. The visual arts and architecture benefited from $229 million in 2018, including a $4 million grant from the Bernard and Anne Spitzer Charitable Trust to the City College of New York for the Bernard and Anne Spitzer School of Architecture.
Grants by Support Strategy
An important caveat to report with regard to the allocation of foundation dollars by specific support strategy is that for roughly one-fifth of arts grant dollars in the 2018 Candid sample, the support strategy could not be identified. This means that modest differences in percentages may not be reliable.7
The arts compared to other foundation fields of giving.
The three largest categories of support tracked by Candid are general operating support, program support, and capital support.
General operating support received the largest share of arts grants dollars in 2018 (25% of all arts funding). The shares of grant dollars and number of grants allocated for this support strategy in 2018 were higher for arts and culture (25% and 27%, respectively) than the overall share directed to general operating support by the Foundation 1000 foundations, which accounted for 19% of grant dollars and 22% of the number of grants.
Program support accounted for the second largest share of arts grant dollars in 2018 (24% of all arts funding). Special programs and projects typically receive one of the largest shares of arts and culture grant dollars and grants. In fact, the same is true in most of the major fields, such as health and education, where program support consistently accounts for one of the largest shares of funding.
Capital support accounted for the third largest share of arts grant dollars. Similar to general support, the share of grant dollars allocated for this type of support was also higher for arts and culture (14%) than for grants overall (8%). Grants for capital support are larger on average than awards for program and general operating support, and exceptionally large capital grants can have a pronounced effect on the distribution of funding by support strategy.
Arts grants by specific types of support.
Table 1 provides a breakdown of more specific support strategies within the larger support categories and lists both the specific dollar value and number of grants made in each type. As for all data in the “snapshot,” it is important to keep in mind that this table includes only grants of $10,000 or more awarded to organizations by a sample of the top 1,000 foundations by total giving. It is also important to note that about one-fifth of the arts grant dollars in this sample did not have a specified support strategy.
TABLE 2: Arts grants by grant size, 2018
| Grant range | Number of grants | % | Dollar amount | % |
|---|---|---|---|---|
| $5 million and over | 71 | 0.4 | $810,458,054 | 27.1 |
| $1 million – under $5 million | 453 | 2.4 | 774,077,922 | 25.9 |
| $500,000 – under $1 million | 581 | 3.0 | 362,906,089 | 12.1 |
| $100,000 – under $500,000 | 3,302 | 17.3 | 628,599,154 | 21.0 |
| $50,000 – under $100,000 | 2,952 | 15.5 | 181,671,077 | 6.1 |
| $25,000 – under $50,000 | 4,174 | 21.9 | 128,053,190 | 4.3 |
| $10,000 – under $25,000 | 7,541 | 39.5 | 104,134,503 | 3.5 |
| Total | 19704 | 100.0 | $2,989,899,989 | 100.0 |
Source: Candid, 2021. Based on all grants of $10,000 or more awarded by 1,000 of the largest foundations representing approximately half of total giving by all US private and community foundations.
Grants by Grant Size
Median grant size.
The median or “typical” grant amount for arts and culture in 2018 was $28,150, which was below the median amount for all foundation grants ($35,000).8 While this is the fourth consecutive year that the median arts grant amount has exceeded $25,000* more study would be required to determine whether this is a lasting upswing in the size of arts grants.9
Small and midsized grants.
Roughly two-thirds (61%) of all arts grants in the 2018 sample were for amounts between $10,000 and $49,999, nearly unchanged from the 2017 share. The share of midsized arts grants ($50,000 to $499,999) also remained consistent, accounting for one-third of arts grants.
Large grants.
The share of larger arts grants ($500,000 and over) remained consistent, between 5–6% of the total number of arts grants in 2018. Their share of total grant dollars remained roughly the same accounting for 65%. Overall, foundations in the sample made 158 arts grants of at least $2.5 million in 2018, up from 126 grants in 2017.
In addition to the $10 million general support award from the Community Foundation of Greater Memphis to Ballet Memphis noted earlier, examples of other especially large grants in 2018 include Bloomberg Philanthropies $20 million grant for support and maintenance for the Shed NYC, a cultural center that commissions, produces, and presents a wide range of activities in performing arts, visual arts, and pop culture; a $5.4 million grant from the Doris Duke Charitable Foundation to the New England Foundation for the Arts to support the National Dance Project, which enables artists to create, present and tour new dance work; and a $3 million award from the Avenir Foundation to the Denver Art Museum for the museum’s Vision 2021 campaign.
TABLE 3. Twenty-five largest arts, culture, and media funders, 2018
| Rank | Foundation | State | Number of arts grants | Arts grant dollars | Total grant dollars | Arts as % of total dollars | Arts capital support dollars | Arts other support dollars |
|---|---|---|---|---|---|---|---|---|
| 1. | Andrew W. Mellon Foundation | NY | 261 | $192,902,274 | $310,707,774 | 62.1 | $29,971,000 | $181,992,274 |
| 2. | Silicon Valley Community Foundation | CA | 465 | 150,488,180 | 1,946,989,438 | 7.7 | 325,000 | 8,146,037 |
| 3. | Greater Kansas City Community Foundation | MO | 95 | 97,440,146 | 249,460,563 | 39.1 | 10,200 | 28,774,459 |
| 4. | Windgate Charitable Foundation | AR | 146 | 82,689,051 | 110,295,901 | 75.0 | 22,750,000 | 67,545,251 |
| 5. | Lilly Endowment, Inc. | IN | 76 | 73,002,997 | 509,982,399 | 14.3 | 3,051,756 | 69,400,951 |
| 6. | The Columbus Foundation | OH | 252 | 55,691,333 | 170,259,769 | 32.7 | 56,212 | 54,227,770 |
| 7. | Bloomberg Philanthropies, Inc. | NY | 20 | 40,755,700 | 560,123,788 | 7.3 | 22,750,000 | 17,574,700 |
| 8. | Doris Duke Charitable Foundation, Inc. | NY | 64 | 39,928,600 | 88,183,842 | 45.3 | 10,000,000 | 29,393,600 |
| 9. | 136 Fund | NY | 3 | 39,000,000 | 39,000,000 | 100.0 | - | 38,750,000 |
| 10. | Walton Family Foundation | AR | 62 | 37,266,810 | 480,632,074 | 7.8 | - | 34,709,894 |
| 11. | Eli & Edythe Broad Foundation | CA | 19 | 37,184,478 | 153,502,455 | 24.2 | 1,000,000 | 36,975,328 |
| 12. | NoVo Foundation | NY | 44 | 35,387,500 | 226,692,745 | 15.6 | - | 33,537,500 |
| 13. | Drue Heinz Trust | PA | 8 | 35,158,451 | 37,750,451 | 93.1 | - | 35,158,451 |
| 14. | The Davee Foundation | IL | 19 | 35,120,000 | 93,579,500 | 37.5 | - | 35,120,000 |
| 15. | Ford Foundation | NY | 118 | 31,979,000 | 503,632,619 | 6.3 | 2,300,000 | 29,979,000 |
| 16. | The Grainger Foundation, Inc. | IL | 26 | 30,852,072 | 66,887,652 | 46.1 | 5,276,336 | 30,567,072 |
| 17. | Dodge Jones Foundation | TX | 14 | 30,716,796 | 109,250,072 | 28.1 | 303,250 | 30,625,796 |
| 18. | Community Foundation of Greater Memphis | TN | 174 | 28,933,871 | 200,542,919 | 14.4 | 6,146,782 | 25,474,219 |
| 19. | The San Francisco Foundation | CA | 131 | 28,318,624 | 145,937,247 | 19.4 | 14,591,053 | 21,433,138 |
| 20. | The Shubert Foundation, Inc. | NY | 484 | 27,925,000 | 29,525,000 | 94.6 | - | 2,787,000 |
| 21. | The Freedom Forum, Inc. | DC | 1 | 26,583,292 | 34,787,030 | 76.4 | - | 26,583,292 |
| 22. | John S. and James L. Knight Foundation | FL | 122 | 26,233,183 | 87,000,340 | 30.2 | 500,000 | 19,080,816 |
| 23. | The Brown Foundation, Inc. | TX | 163 | 25,423,305 | 63,487,053 | 40.0 | 14,581,271 | 22,508,379 |
| 24. | The William and Flora Hewlett Foundation | CA | 129 | 24,514,500 | 418,365,964 | 5.9 | 1,250,000 | 24,414,500 |
| 25. | Charles Stewart Mott Foundation | MI | 12 | 24,089,490 | 122,674,079 | 19.6 | 19,750,000 | 4,339,490 |
| Total | 2,908 | $1,257,584,653 | $6,759,250,674 | 18.6 | $154,612,860 | $934,181,917 |
Source: Foundation Center by Candid, 2021. Based on all grants of $10,000 or more awarded by 1,000 of the largest foundations representing approximately half of total giving by all US private and community foundations. Grants may provide capital support and other types of support. In these cases, grants would be counted in both totals. Figures include only grants that could be coded as providing specific types of support.
The twenty-five largest arts funders.
The top twenty-five arts funders by giving amount provided 42% of the total arts dollars in Candid’s 2018 sample, above the 38% share from 2017. Overall, the share of giving accounted for by the top twenty-five arts funders has fluctuated between roughly 30–40% since the end of the 1990s.
Top foundations by share of arts giving out of overall giving.
Of the foundations that committed large percentages of their grant dollars to arts and culture, many are smaller foundations in the sample. Among the top one hundred foundations ranked by share of arts giving out of total giving, one-third (or 32 funders) gave less than $5 million in total arts grant dollars in 2018.
TABLE 4. Top 35 foundations by share of arts giving out of overall giving, 2018
| Rank | Foundation | State | Fdn Type* | Number of arts grants | Arts grant dollars | Total grant dollars | Arts as % of total dollars | Arts capital support dollars** | Arts other types of support dollars** |
|---|---|---|---|---|---|---|---|---|---|
| 1. | 136 Fund | NY | CS | 3 | $39000000 | $39000000 | 100.0 | - | $38750000 |
| 2. | Jerome Foundation, Inc. | MN | IN | 91 | 4433000 | 4433000 | 100.0 | - | 4433000 |
| 3. | Johnson Art and Education Foundation | NJ | IN | 2 | 3750000 | 3750000 | 100.0 | - | 3750000 |
| 4. | Hsu Family Foundation, Inc. | FL | IN | 1 | 1250000 | 1250000 | 100.0 | - | 1250000 |
| 5. | The William C. and Susan F. Morris Foundation | NY | IN | 1 | 100000 | 100000 | 100.0 | - | 100000 |
| 6. | The Harriet and Esteban Vicente Foundation, Inc. | NY | IN | 2 | 100000 | 100000 | 100.0 | - | 100000 |
| 7. | The Querrey Simpson Charitable Foundation | FL | IN | 1 | 31441 | 31441 | 100.0 | - | 31441 |
| 8. | The Walt and Lilly Disney Foundation | CA | IN | 4 | 9399901 | 9534907 | 98.6 | - | 100000 |
| 9. | The SHS Foundation | NY | IN | 56 | 5802300 | 6052300 | 95.9 | 25000 | 2862300 |
| 10. | The Shubert Foundation, Inc. | NY | IN | 484 | 27925000 | 29525000 | 94.6 | - | 27870000 |
| 11. | Muriel McBrien Kauffman Foundation | MO | IN | 71 | 12794446 | 13724446 | 93.2 | 610000 | 11929924 |
| 12. | Drue Heinz Trust | PA | IN | 8 | 35158451 | 37750451 | 93.1 | - | 35158451 |
| 13. | Lloyd E. Rigler-Lawrence E. Deutsch Foundation | CA | IN | 8 | 5892590 | 6337590 | 93.0 | - | - |
| 14. | The Riggio Foundation | NY | IN | 15 | 4055000 | 4654105 | 87.1 | 2320000 | 1720000 |
| 15. | Dunard Fund USA, Inc. | IL | CS | 14 | 2920474 | 3429875 | 85.1 | - | 2920474 |
| 16. | Howard Gilman Foundation | NY | IN | 153 | 15815000 | 18988750 | 83.3 | 925000 | 15500000 |
| 17. | J. Paul Getty Trust | CA | OP | 107 | 8631000 | 10601222 | 81.4 | 2635307 | 8380500 |
| 18. | Ann and Gordon Getty Foundation | CA | IN | 88 | 7455000 | 9192500 | 81.1 | - | 134500 |
| 19. | Terra Foundation for American Art | IL | IN | 38 | 9085182 | 11273477 | 80.6 | 35000 | 7112346 |
| 20. | The Packard Humanities Institute | CA | OP | 8 | 4760275 | 5944275 | 80.1 | - | 4435000 |
| 21. | The Christensen Fund | CA | IN | 14 | 4342900 | 5434900 | 79.9 | - | 4307900 |
| 22. | The Florence Gould Foundation | NY | IN | 31 | 4348110 | 5501047 | 79.0 | 524460 | 3698110 |
| 23. | Bonfils-Stanton Foundation | CO | IN | 48 | 2267500 | 3392500 | 77.5 | 810000 | 1917500 |
| 24. | The Lee and Juliet Folger Fund | VA | IN | 13 | 3953000 | 5163000 | 76.6 | 3338000 | 2911000 |
| 25. | The Freedom Forum, Inc. | DC | OP | 1 | 26583292 | 34787030 | 76.4 | - | 26583292 |
| 26. | Arison Arts Foundation | FL | IN | 37 | 17053599 | 22403599 | 76.1 | - | 17053599 |
| 27. | Windgate Charitable Foundation, Inc. | AR | IN | 146 | 82689051 | 110295901 | 75.0 | 22750000 | 67545251 |
| 28. | Millicent and Eugene Bell Foundation | MA | IN | 4 | 66500 | 91500 | 72.7 | - | 66500 |
| 29. | The Sidney E. Frank Foundation | CA | IN | 44 | 11037505 | 15710455 | 70.3 | 305000 | 10877275 |
| 30. | The Goatie Foundation | OH | IN | 11 | 6025000 | 8955000 | 67.3 | 4025000 | 5135000 |
| 31. | The Laurie M. Tisch Foundation, Inc. | NY | IN | 57 | 12922500 | 19915431 | 64.9 | 3350000 | 5420000 |
| 32. | The Andrew W. Mellon Foundation | NY | IN | 261 | 192902274 | 310707774 | 62.1 | 29971000 | 181992274 |
| 33. | O’Donnell Foundation | TX | IN | 5 | 1888333 | 3058676 | 61.7 | - | 1888333 |
| 34. | The Hsieh Family Foundation | CA | IN | 4 | 557500 | 903490 | 61.7 | - | 557500 |
| 35. | First Horizon Foundation | TN | CS | 127 | 3634710 | 5896417 | 61.6 | - | 3609710 |
Source: Candid, 2021. Based on all grants of $10,000 or more awarded by 1,000 of the largest foundations representing approximately half of total giving by all US private and community foundations.
* IN = Independent; OP = Operating; CS = Corporate
** Grants may provide capital support and other types of support. In these cases, grants would be counted in both totals. Figures include only grants that could be coded as providing specific types of support.
Giving for international cultural exchange
Grant dollars supporting international cultural exchange was down 14% between 2017 and 2018 among a matched subset of funders. In 2018, foundations awarded 131 grants related to international cultural exchange totaling $14.5 million. Among the larger awards was a $1 million grant from the Andrew W. Mellon Foundation to Mid Atlantic Arts Foundation for its USArtists International program which supports performances by US artists at impactful international festivals and performing arts marketplaces outside the United States and its territories.
Reina Mukai currently serves as manager on the Global Projects & Partnerships team at Candid (formerly Foundation Center and GuideStar). In this role, she works on a range of research and data-driven projects. Mukai has authored numerous reports on national, regional, and special-topic trends in the field of philanthropy, among them, Giving in Illinois, Arts Funding Snapshot: GIA’s Annual Research on Support for Arts and Culture, and the Key Fact Sheet series. She also works with partners on custom data consulting services and research projects.
NOTES
- Candid’s 2018 Foundation 1000 set includes all grants of $10,000 or more reported by 1,000 of the largest US independent, corporate, community, and grantmaking operating foundations by total giving. For community foundations, the set includes only discretionary grants and donor-advised grants (when provided by the funder). The set excludes grants to individuals. This set accounts for approximately half of giving by all of the roughly 86,000 active US-based private and community foundations. Grant amounts may represent the full authorized amount of the grant or the amount paid in that year, depending on the information made available by each foundation.
- Between 2017 and 2018 the composition of the Foundation 1000 has changed, which could distort year-to-year fluctuations in grant dollars targeting specific issue areas. To account for these potential distortions year to year, Candid has analyzed changes in giving based on a subset of 839 funders for which we had 2017 and 2018 data.
- Candid provides statistics based on share of number of grants, which are not skewed by exceptionally large grants.
- Included within the humanities is funding for art history, history and archaeology, classical and foreign languages, linguistics, literature, philosophy, and theology.
- Includes support for archaeology, art history, modern and classical languages, philosophy, ethics, theology, and comparative religion.
- Includes support for multidisciplinary centers, arts councils, artist’s services, arts administration, arts exchange, and arts education.
- The grant records available to Candid often lack the information necessary to identify the support strategy. For example, it is often the case that the only source of data on grants is the 990-PF tax return, and this tends to be less complete than other forms of grant reporting.
- The median — meaning that half of the grants are above and half are below the amount — is generally acknowledged to be a more representative measure of the typical grant than the mean or “average,” because the median is not influenced by extreme high or low amounts.
- Prior to 2015, the median amount had remained consistent at $25,000 since the early 1990s.